
At the moment, installers are often asked whether a photovoltaic system is still worth it at all.
In this article we take a clear look at the facts and show you which factors are decisive for profitability.
The profitability of a system does not depend only on the price. It is determined by several parameters that you should know when giving advice or making decisions.
Table 1 shows how the profitability of a sample system with 5.6 kWp changed between 2024 and 2025. The payback period increased from 10 to 16 years during this time.
Tax savings
Electricity costs and self-consumption
Romande Energie SA
Profit and loss statement of the photovoltaic system
| Tax savings | 2024 | 2025 | |
| Taxable income | CHF/year | 100'000 | 100'000 |
| Marginal tax rate | % | 25.0 | 25.0 |
| Electricity costs and self-consumption Romande Energie SA | 2024 | 2025 | |
| Feed-in tariff | Rp./kWh | 18.6 | 9.3 |
| High tariff | Rp./kWh | 39.6 | 30.8 |
| Low tariff | Rp./kWh | 26.1 | 30.8 |
| Self-consumption rate | % | 25.7 | 25.7 |
| Profit and loss statement of the photovoltaic system | 2024 | 2025 | |
| Investment costs | CHF | -21'670 | -21'670 |
| One-time small-scale remuneration (KLEIV) | CHF | 2'016 | 2'016 |
| Other subsidies | CHF | 0 | 0 |
| Tax savings | CHF | 4'036 | 4'036 |
| Self-consumption savings | CHF | 25'041 | 20'526 |
| Feed-in revenue | CHF | 33'301 | 16'651 |
| Operating expenses | CHF | -7'538 | -7'538 |
| Profit | CHF | 35'186 | 14'021 |
| Average return | % | 4.0 | 2.2 |
| Payback period | Years | 10 | 16 |
How does this change in profitability come about? Below we analyze the most important variables using the example of a 5.6 kWp system in Villeneuve with the return calculator from EnergieSchweiz.
Investment costs
The basis of every profitability calculation is the level of investment. What matters is not only the price per kWp. Subsidies such as the one-time compensation from Pronovo at federal level as well as tax savings significantly reduce the effective cost of a system.
Subsidies
Calculate with the
Also check with the
Tax savings
Those who pay income tax can in many cases deduct the investment for tax purposes. The amount of savings depends on the canton and individual situation. With a taxable income of 100,000 CHF and a marginal tax rate of 25%, this results in tax savings of more than 4,000 CHF.
Operating costs
For rooftop systems, maintenance is usually inexpensive. Expect 2 to 3 Rp./kWh. Costs for monitoring, insurance, and cleaning if necessary should still be taken into account.
Electricity tariffs
In 2024, a household in the canton of Vaud paid an average of 33.64 Rp./kWh for electricity, according to ElCom. For solar power fed into the grid, producers received an average of 18.6 Rp./kWh according to VESE, about half of the purchase price.
In 2025 the situation looks different: purchase prices dropped to 30.76 Rp./kWh, feed-in compensation to 9.25 Rp./kWh.
The extension of the payback period from 10 to 16 years can be explained mainly by the significantly lower revenue from kilowatt hours fed into the grid.
In the 2024 calculation, feed-in revenue was 33,301 CHF. In the 2025 calculation, it drops to 16,651 CHF.
The feed-in tariff therefore remains a central but uncertain factor in profitability calculations.
The analysis shows: Self-consumption is decisive for profitability
If you consume your solar power yourself, you save almost three times as much in 2025 compared to feeding it into the grid. This makes self-consumption the key to profitability.
If the photovoltaic system is aligned with household consumption, meaning the annual PV production is approximately equal to annual consumption, self-consumption usually amounts to only 15 to 30 percent. This means 70 to 85 percent of the solar power is fed into the grid.
The Swissolar profitability calculator shows how self-consumption affects payback time and profitability. The assumptions are shown in Table 2.
| System capacity | 5.6 kWp |
| Financing | Komplett eigenfinanziert |
| Investment costs | 5.6 kWp x 3'141 CHF = 17'590 CHF |
| Tax savings | 3'517 CHF |
| Pronovo KLEIV | 2'016 CHF |
| Specific annual yield | 1'100 kWh/kWp |
| Service life | 25 Years |
| Total production after 25 years | 85% der Anfangsleistung |
| Specific operating and maintenance costs | 0.02 CHF/kWh |
| Feed-in compensation | 0.093 CHF |
| Electricity purchase tariff | 0.308 CHF |
Table 3 shows the key figures for an expected self-consumption rate of 26%. This assumes unchanged household electricity consumption.
| Ø Annual energy production | 5'907 kWh/year |
| Ø Annual yield | 391 CHF/year |
| Ø Avoided electricity purchase | 455 CHF/year |
| Ø Output VAT | 0 CHF/year |
| Ø Input VAT | 0 CHF/year |
| Ø Maintenance costs | -114 CHF/year |
| Ø Cost of equity | -474 CHF/year |
| Ø Cost of debt | 0 CHF/year |
| Ø Net revenue | 257 CHF/year |
| Net present value (NPV) | 6'236 CHF |
| Payback period | 16 Years |
| Cost per kWh | 0.1 CHF/kWh |
To help your customers benefit from higher self-consumption and better profitability, recommend solar monitoring. It makes self-consumption visible and helps adjust behavior to solar production.
With targeted use during sunny hours, self-consumption of up to 40% is possible. Examples include running dishwashers and tumble dryers during the day.
Table 4 shows that higher self-consumption reduces the payback period to 13 years.
| Ø Annual energy production | 5'907 kWh/year |
| Ø Annual yield | 317 CHF/year |
| Ø Avoided electricity purchase | 699 CHF/year |
| Ø Output VAT | 0 CHF/year |
| Ø Input VAT | 0 CHF/year |
| Ø Maintenance costs | -114 CHF/year |
| Ø Cost of equity | -474 CHF/year |
| Ø Cost of debt | 0 CHF/year |
| Ø Net revenue | 428 CHF/year |
| Net present value (NPV) | 10'508 CHF |
| Payback period | 13 Years |
| Cost per kWh | 0.1 CHF/kWh |
If self-consumption is to be increased further, heating with a heat pump is a particularly effective solution. With smart control, self-consumption shares of up to 60% can be achieved. In our example in Table 5, the system pays for itself after just 10 years.
| Ø Annual energy production | 5'907 kWh/year |
| Ø Annual yield | 211 CHF/year |
| Ø Avoided electricity purchase | 1'049 CHF/year |
| Ø Output VAT | 0 CHF/year |
| Ø Input VAT | 0 CHF/year |
| Ø Maintenance costs | -114 CHF/year |
| Ø Cost of equity | -474 CHF/year |
| Ø Cost of debt | 0 CHF/year |
| Ø Net revenue | 672 CHF/year |
| Net present value (NPV) | 16'610 CHF |
| Payback period | 10 Years |
| Cost per kWh | 0.1 CHF/kWh |
If an electric car is integrated into the overall system, significant additional increases in self-consumption can be achieved. Table 6 shows potentials of up to 70%. The crucial factor is that the car can be charged at home during midday hours.
| Ø Annual energy production | 5'907 kWh/year |
| Ø Annual yield | 158 CHF/year |
| Ø Avoided electricity purchase | 1'224 CHF/year |
| Ø Output VAT | 0 CHF/year |
| Ø Input VAT | 0 CHF/year |
| Ø Maintenance costs | -114 CHF/year |
| Ø Cost of equity | -474 CHF/year |
| Ø Cost of debt | 0 CHF/year |
| Ø Net revenue | 794 CHF/year |
| Net present value (NPV) | 19'661 CHF |
| Payback period | 9 Years |
| Cost per kWh | 0.1 CHF/kWh |
The final measure to increase self-consumption is investment in a battery storage system. We will cover this topic in a separate blog post.
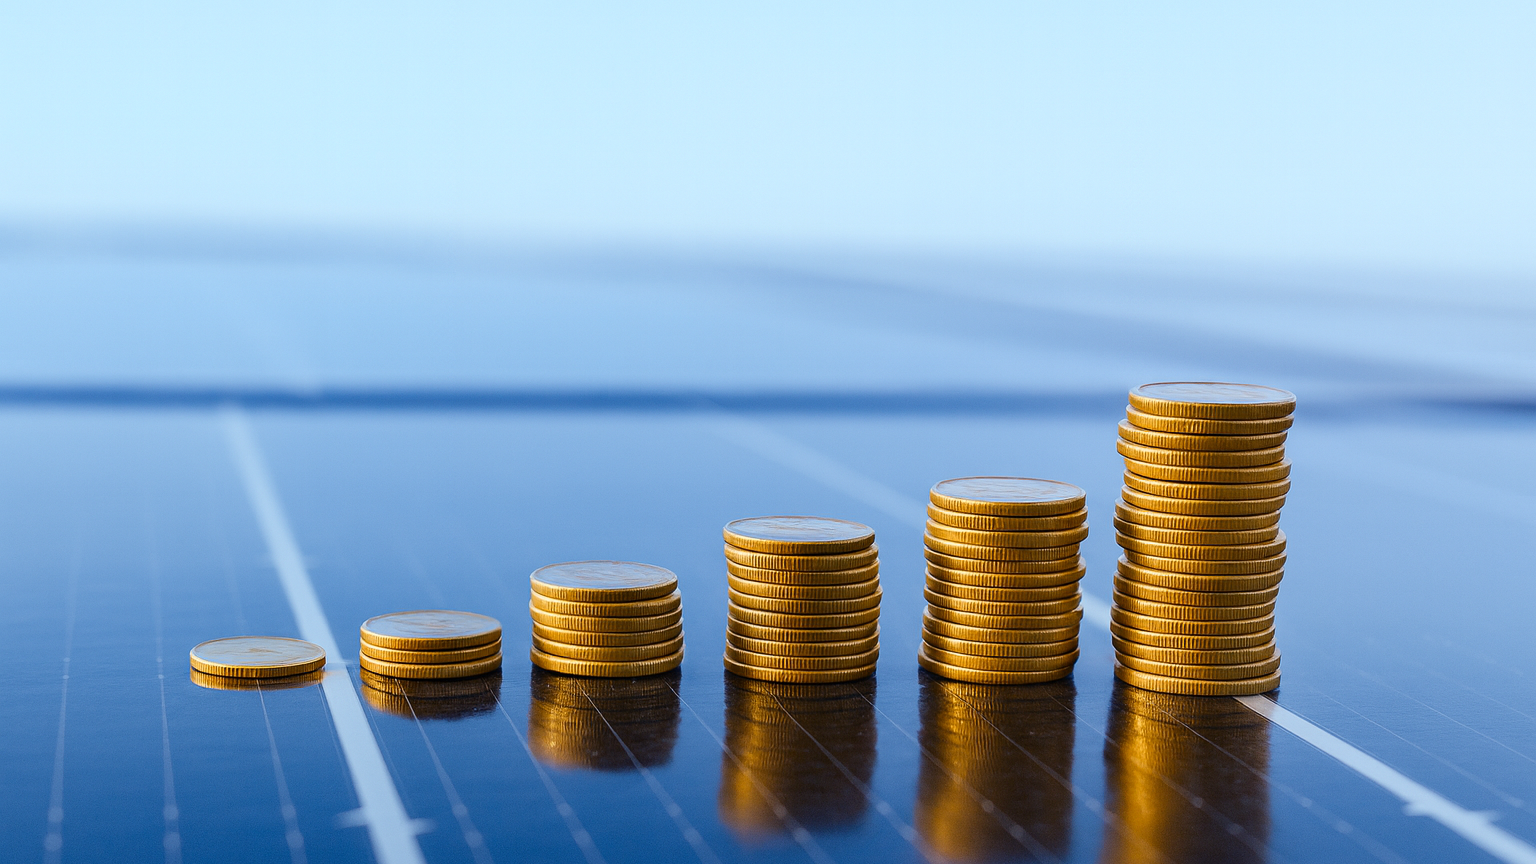
Figure 7 provides a clear summary of the various measures to increase self-consumption.
Conclusion: Solar is still worth it, with the right conditions.
Profitability depends less on the price per kWp and much more on self-consumption. Those who use as much solar power as possible themselves, for example through the smart control of household appliances, a heat pump, or an electric car, can significantly shorten the payback period.
While with 26% self-consumption the payback takes 16 years, with 60% it can be reached in just 10 years.
In summary:
- Self-consumption is the key to profitability
- Feed-in tariffs are uncertain and tend to decline
- Consulting, monitoring, and smart control make the difference
Recommended Links
Pronovo
Tariff calculator
Quickly calculate the current one-time remuneration for your solar power.
EnergieSchweiz
Cost and benefit calculator
Calculate the profitability of your solar system with the EnergieSchweiz solar calculator.
Energiefranken
Funding programs for energy and mobility
Find funding programs near you for buildings, mobility and local energy projects.
VESE
PV tariff comparison
Compare solar feed-in tariffs by region and grid operator.